Load Testing Tutorial: Server Monitoring
Originally posted here.
It’s difficult to be a good load tester if you don’t like data, because a lot of the value of the load testing is in the analysis. Even if you successfully generate load against an application, it’s ineffective without enough data to determine how your application coped with the load. At Flood, we’re passionate about data because we know it drives decisions, so we’re always working to improve how we present data generated by our nodes. However, there’s another important source of data that in my experience is too often overlooked by new load testers: your own application servers.
Executing a load test without monitoring server health is like flying blind: you’ll know when you land safely and you’ll know when you crash, but even if you do crash, you won’t know why—or how you can avoid it next time. Monitoring server health is the black box that will tell you what went wrong.
What server metrics should you monitor?
There are a lot of metrics that you can monitor, and we always recommend that you choose what to measure based on your own specific circumstances, such as the purpose for your testing or any previous outages you’ve had in the past. If you’re new to load testing, though, here’s a list of metrics you might consider measuring:
- Processor Time - how much the processor is being utilised
- Processor Interrupt Time - how much time the processor is spending to handle interrupts
- Processor Privileged Time - the time the processor spends handling overhead activities
- Processor Queue Length - the number of threads that are waiting to be executed
- Memory (Available Bytes) - unused memory available to process new requests
- Memory Cache Bytes - the size of the memory cache, which is where copies of frequently accessed data are stored
- Disk I/O - number of reads and writes to the disk during the test
- Disk Idle Time - time that disks are not doing work
- Disk Transfer/sec - average number of seconds that an I/O request takes to complete
- Disk Write/sec - average number of seconds that a write request takes to complete
- Network I/O - bytes sent and received
How do you determine which one to use?
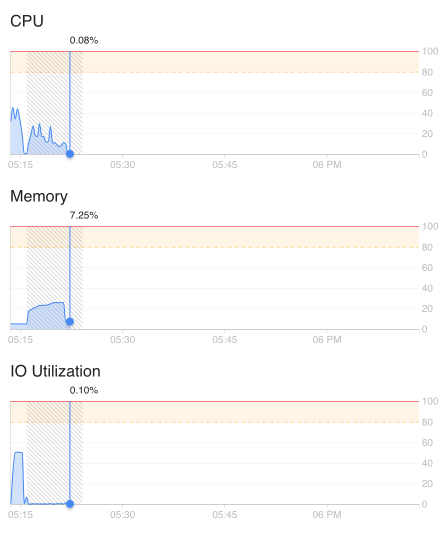
If you’re still not sure where to start: At a minimum, you’ll need the CPU and memory utilisation (in bold in the list above) of every major component you want to test. These two metrics are vital and if either of these is consistently maxing out at (or close to) 100%, that’s a sign that the component is struggling with the number of requests.
As an aside, CPU and memory over-utilisation is a very common reason for less-than-ideal response times on the load generators, which is why we also show you those metrics on our nodes while you’re running the test.
How can you monitor these metrics?
How you get these metrics depends on your budget and your operating system. I’ll start with the free or lower cost methods and work my way up to enterprise solutions.
If your servers are running Windows, PerfMon is a good alternative. It’s built into Windows and the interface allows you to choose the counters that you want to measure and start recording.
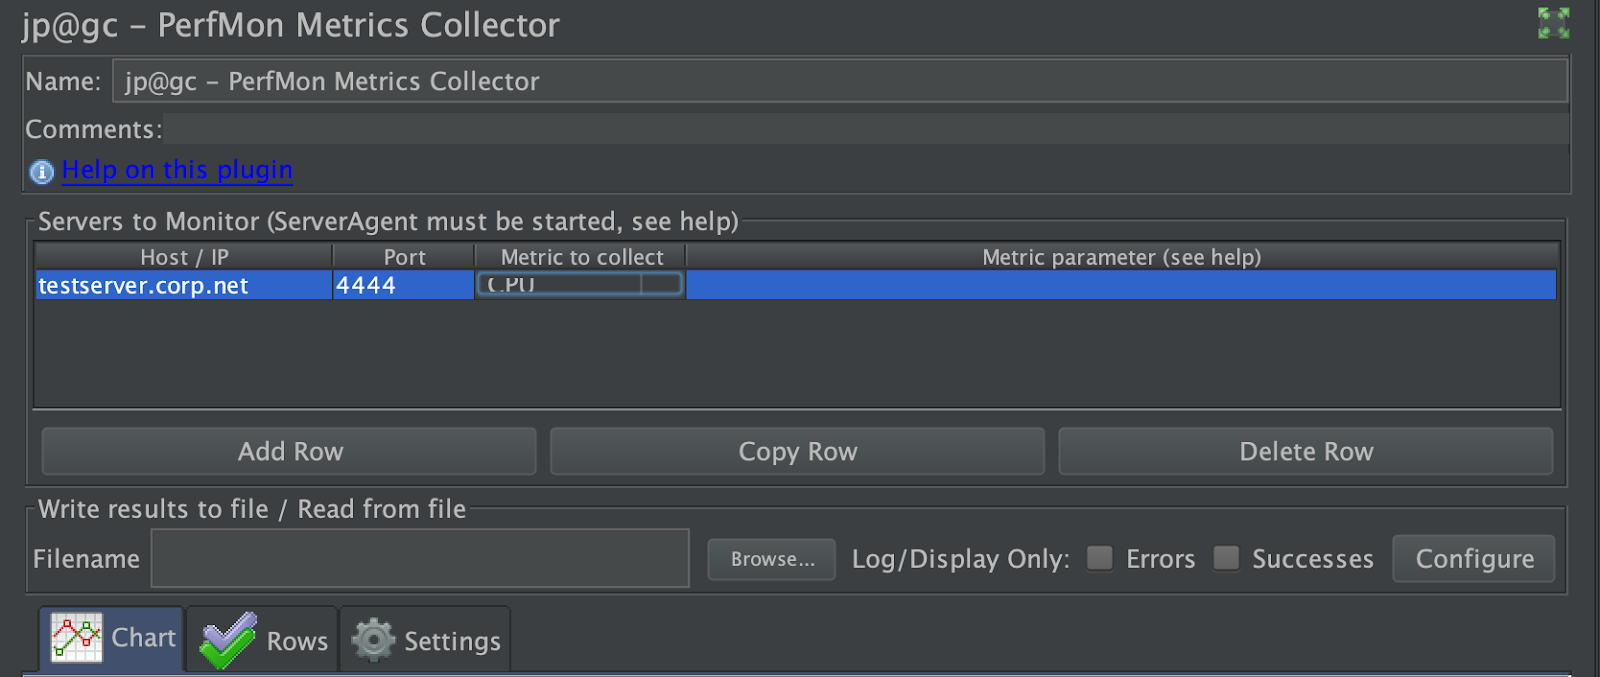
There’s also a JMeter server agent that you can download, confusingly called “PerfMon” but not to be mistaken with Windows’ PerfMon, that you can install on your (Windows or Linux) server and will gather metrics. It’s normally used in conjunction with the PerfMon JMeter plugin.
Nagios Core is another good open-source way to not only collect metrics but also set up alerts when values exceed certain thresholds that you can set.
Moving from free and open-source options to more enterprise solutions, Dynatrace is a powerful tool that allows you to track not just server health but can actually be used to trace individual requests using a custom header.
AppDynamics is another fantastic tool that allows you to really drill down to specific SQL queries that take a long time to execute, for example, feeding you important information to give to your DBAs.
New Relic is another good choice for monitoring production as well as test environments, and we particularly love its thread profiling feature.
Other noteworthy tools are the Microsoft System Center Operations Manager, the Oracle Enterprise Manager, and BlueStripe FactFinder.
Flood offers out of the box integrations with Dynatrace, AppDynamics and New Relic. If you’re already using one of these tools, you can push the load metrics from Flood into the dashboards that you’re already using, allowing you to see both load metrics and server metrics in the same place. Here’s an example of a dashboard our own Antonio Jimenez created in New Relic which combined Flood-provided metrics with server-side metrics:
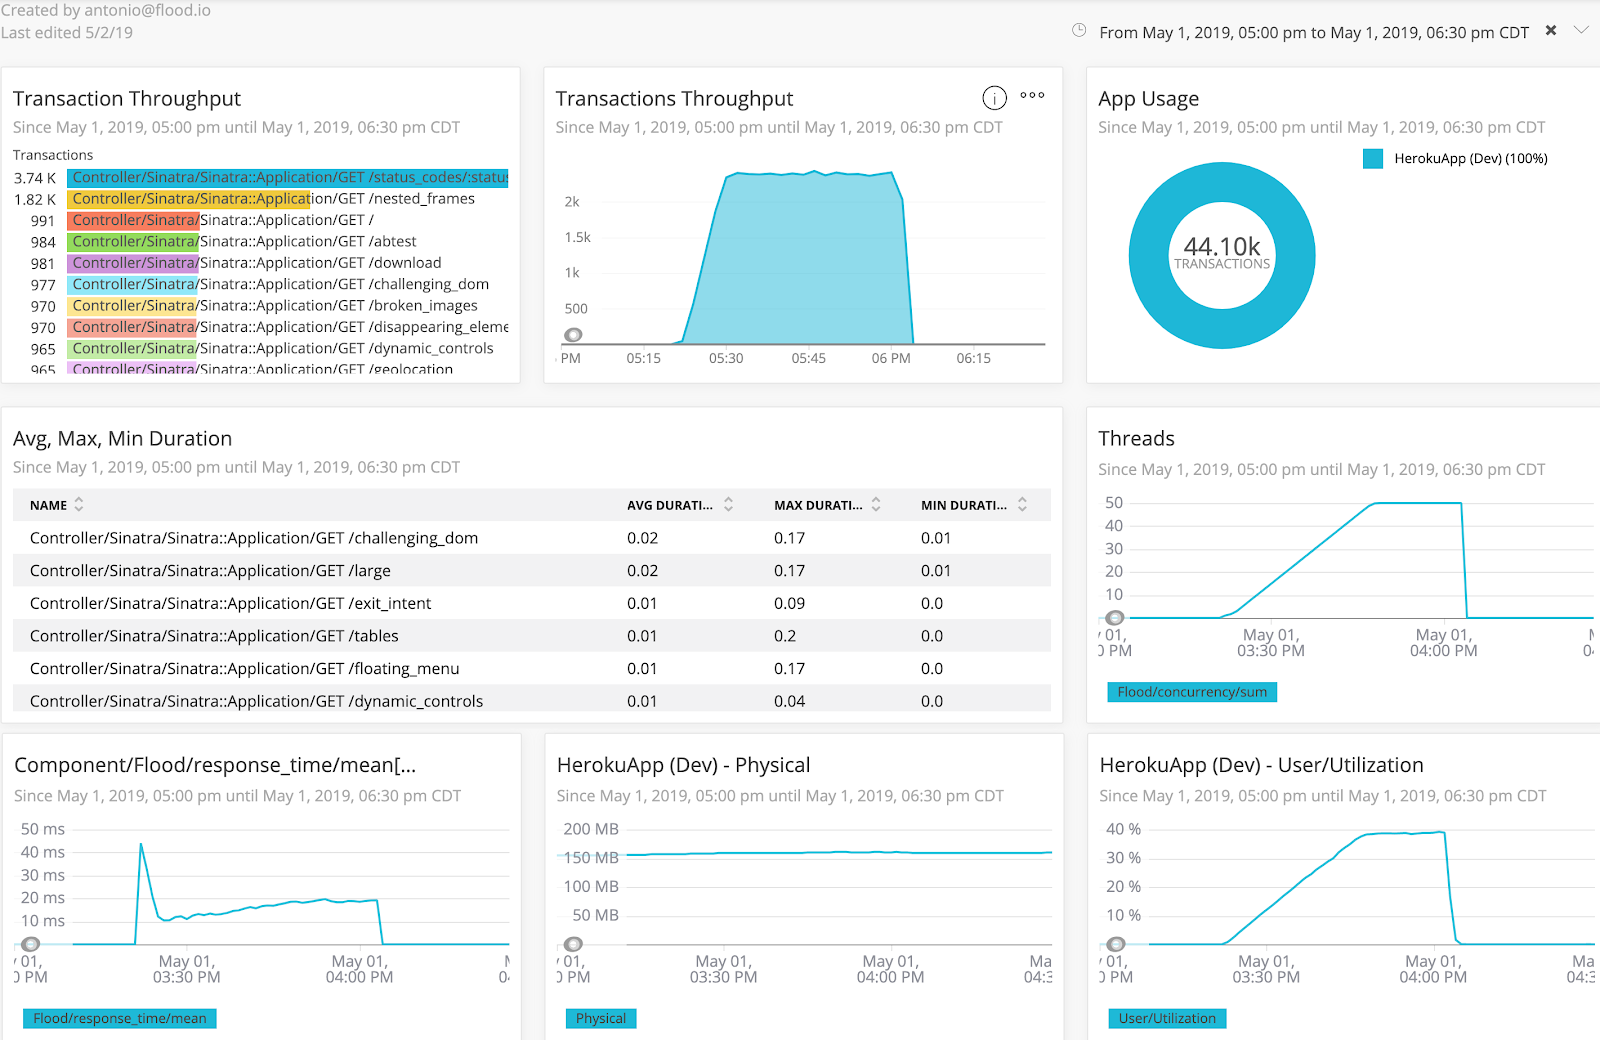
This view helps with spotting correlations or trends across the different sets of data, such as a response time graph that begins to increase at the same time that server memory utilization does.
Putting It All Together
Having both sides of the puzzle, the metrics from the application servers along with those from our load generators, gives you a more holistic look of your application performance as a whole, and increases the value you get from load testing. We’d encourage you to take advantage of the 5 free node hours we provide in our trial to give this integrated load testing solution a spin. You can head on over to Flood to sign up for a free trial which will include 5 free node hours and you can drop us a note to get help integrating Flood with your APM solution.